
The 2017 growing season of a Dutch birch captured by the GrowApp
De Natuurkalender, Wageningen UniversityDeciduous trees experience a spectacular transformation throughout the year, from the unfolding of leaves and blossoming to autumn colouring and shedding of leaves. The timing of these processes depends strongly on various weather factors. This is the research area of the Nature’s calendar. With the help of volunteers and high school students, the Dutch phenological network maps how changes in weather and climate influence the timing of annual phenomena in nature. With the launch of the GrowApp this spring as part of the international educational programme GLOBE, we have obtained a fantastic new research instrument. The GrowApp allows you to easily capture the seasonal changes in time-lapse videos.
Below you can see an example of a birch in Bennekom. As it is located along my way to work, I pass it regularly on my bike. From March 30th until November 17th of 2017, I have taken 39 pictures with the GrowApp, every time from the exact same spot.

Time-lapse video of a birch in Bennekom in 2017 (Source: Arnold van Vliet)
Greenness index
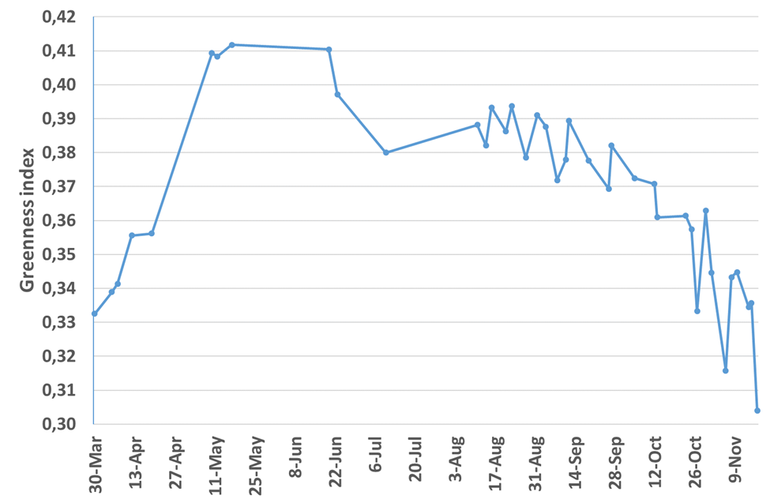
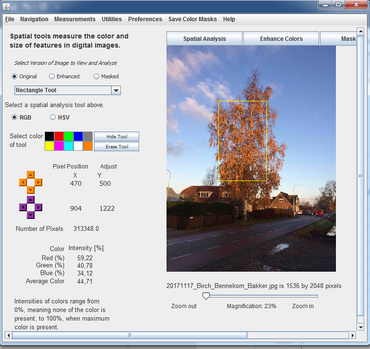 An advantage of the observations made with the GrowApp in comparison to the ‘regular’ phenological observations ‘first flowering’ or ‘first leaf unfolding’ is that you can track gradual changes of the tree. In addition, you can determine the greenness index of, for example, the crown of the tree with the help of the photographs. In order to determine a greenness index you have to define the share of the colour green in relation to the share of the colours red and blue in the selected area. I used the free software programme AnalyzingDigitalImages to do so. The figure below shows the change in the greenness index for all 39 photos of the birch.
I started the photo series exactly on time, as the first leaves were already unfolding on the 4th of April. Quite an early start due to the mild weather in February and especially in March. In this period the greenness index strongly increased. Around the 12th of April leaves had unfolded throughout the entire tree. Around the 10th of May the tree was full of leaves. On the 8th of September I saw the first leaves slowly turning yellow. From the 12th of October the discolouration of the trees increased its pace. From the 13th to the 23rd of October the greenness index clearly decreased. In the last picture of this series, taken on November 17, the tree was still full of leaves, however none were green.
The greenness index can vary strongly due to lighting and the camera settings. However, the course of the greenness index over time nicely matches the moments of leaf unfolding and autumn colouring. The GrowApp pictures and time-lapse videos thus offer a welcome addition to analyse variation in seasonal patterns between locations and years.
More information
- Watch the GrowApp pictures and time-lapse videos and download the GrowApp
- Instruction on the use of the Growapp
- Watch the use of the software AnalyzingDigitalImages in the Youtube video below.